Creating your first Report
Infomaptic allows you to design one template that can be used to generate both live reports visible on the web as well as PDF reports.
This guide is available via text (below, on this page) or as a video here:
Important Terms
- Template - A template is what you build in infomaptic. When you apply data to a template, a report is made. When building a template you select the datasource that is attached and then once published, you can control what data from your datasource is used to populate the template via the query parameter:
key - Data Source - The datasource for your template is where the records come from that are used to populate the template and generate a report. One record -> one report. For each record in your datasource you get one report generated.
- ArcGIS Portal Items - Each report template is stored as an ArcGIS Online Item. This allows you to control who has permissions to generate reports the same way you control access to any other item in your Portal: by adding it to appropriate groups. Much like a web map, you must also ensure the groups have access to the data source that powers the template.
- Publish - While working on a template, you may save as often as you like, your edits are not visible to other users until you press Publish.
Overview of the Template
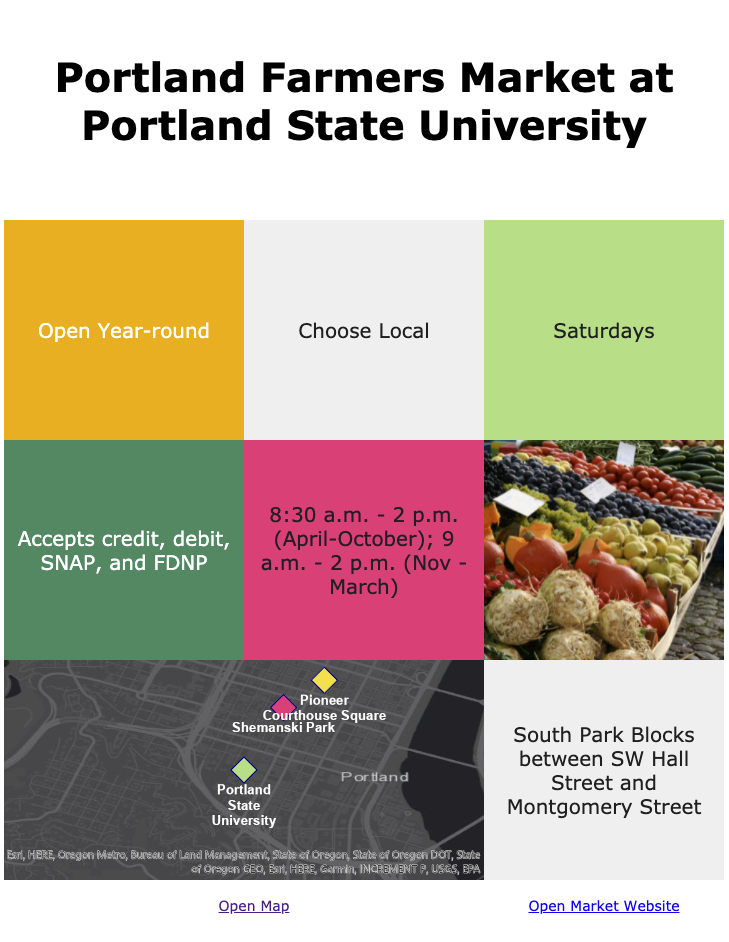
For this example we will be creating a template to be used as flyers for farmer’s markets in the Portland Oregon area. You can find a completed sample at Portland Area Farmer’s Markets Our final output will look something like this:
The Data Source
To create a template, we first need a data source, we will be using this (slightly outdated) dataset that has information about Farmer’s markets, which can be found in ArcGIS Online. You can also checkout the REST endpoint for details about the fields.
1.) Create a new Template
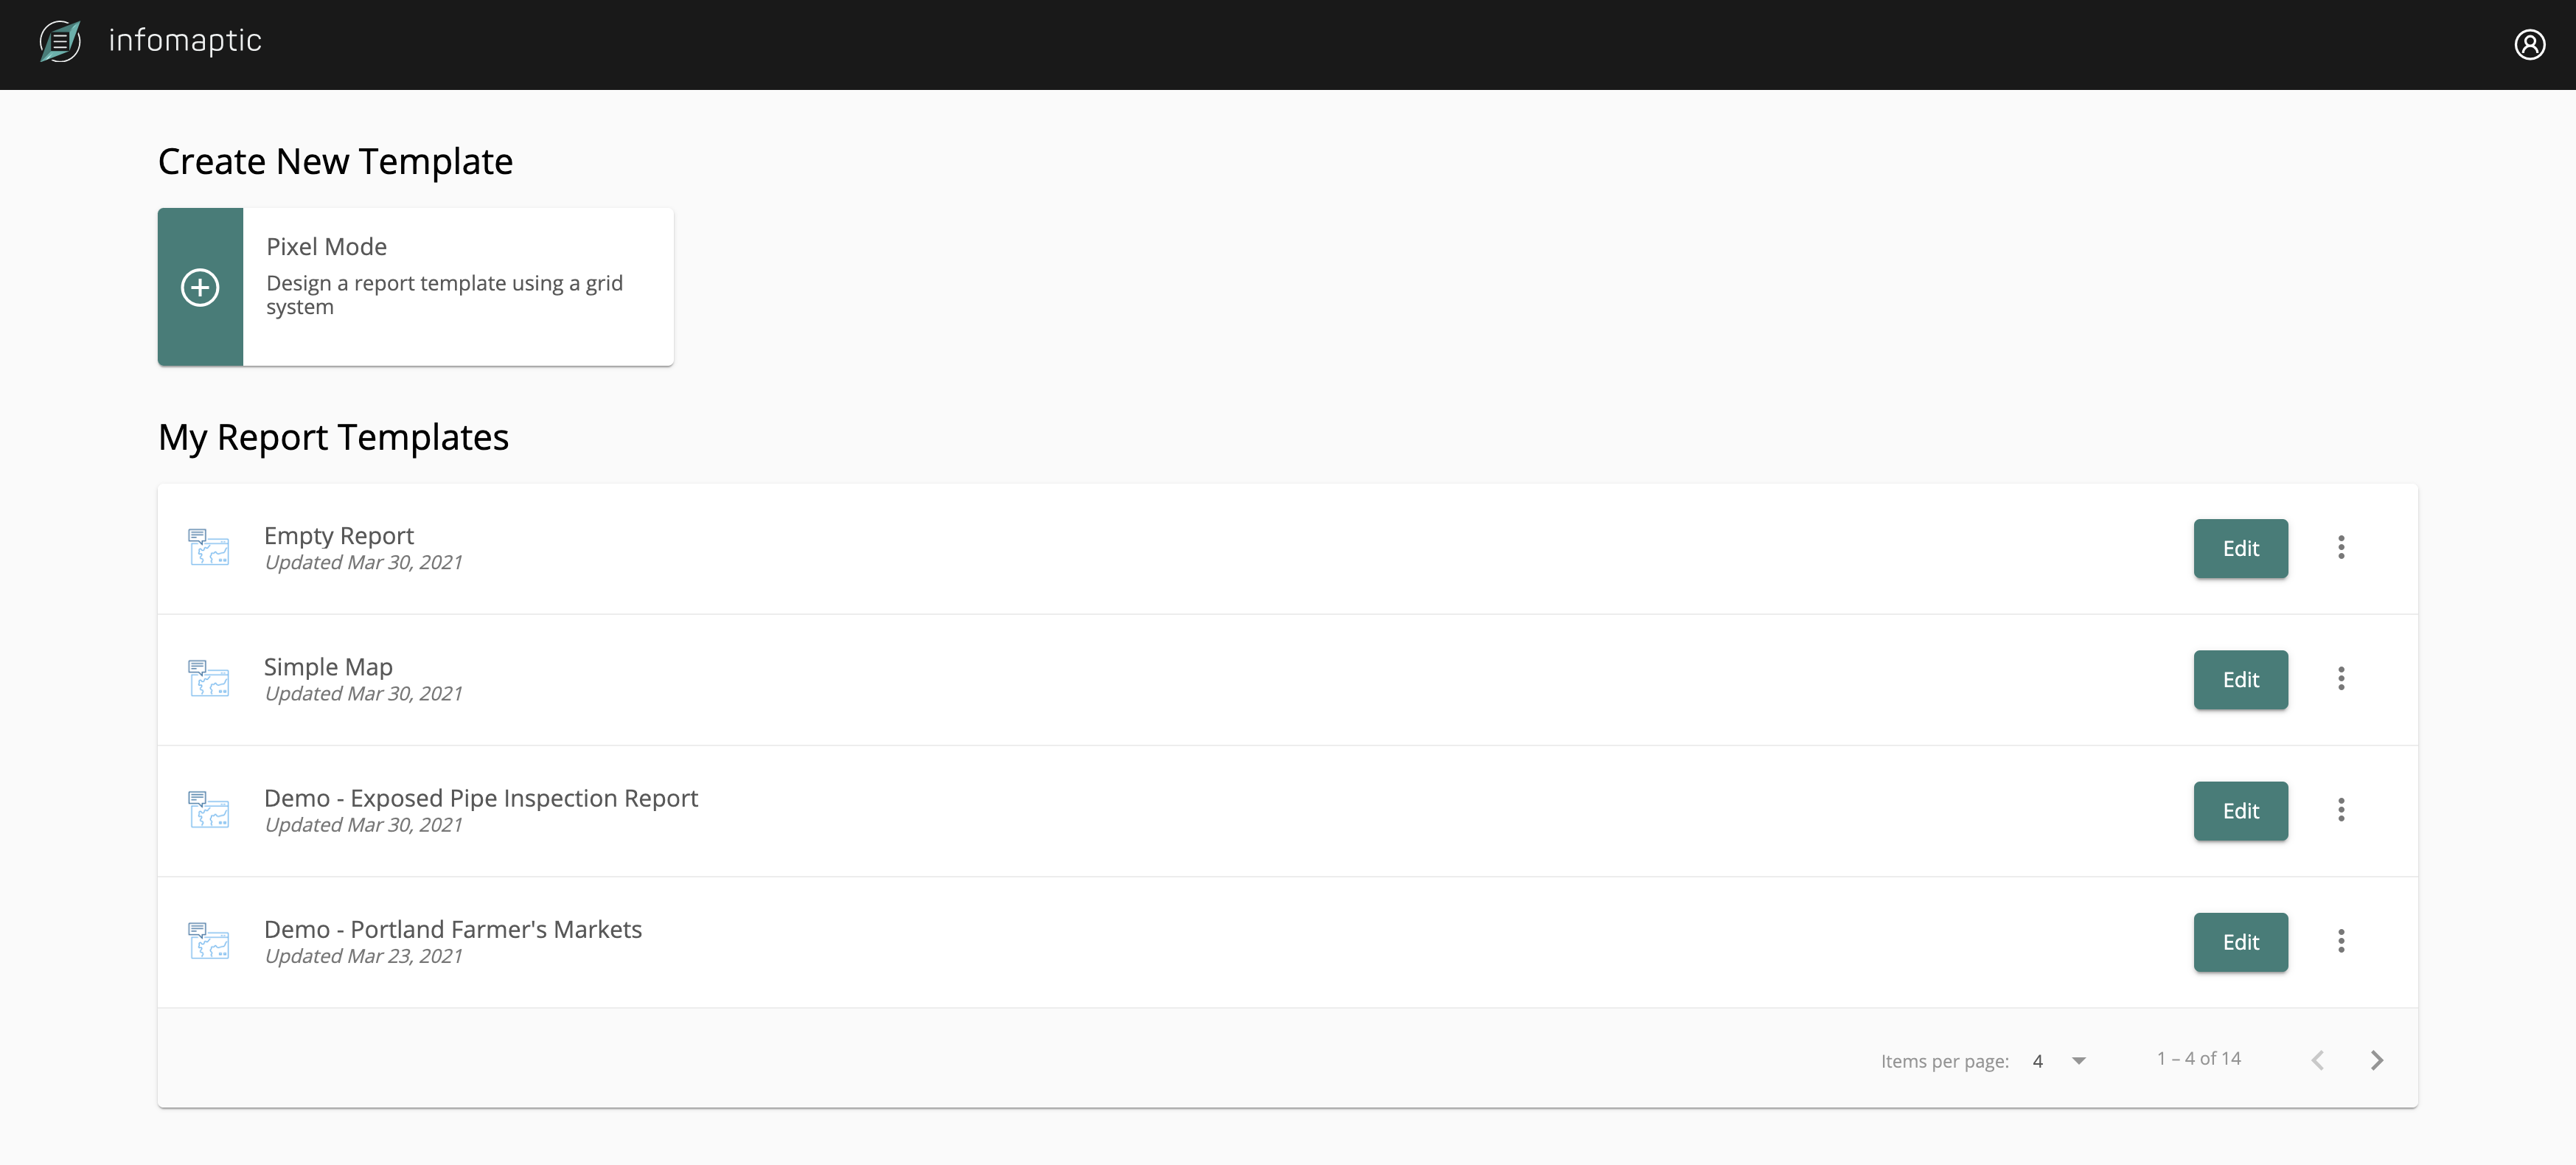
Open app.infomaptic.com in a new browser tab and you should see the dashboard. The dashboard allows you to manage all of your templates. To create a new one, click on the button at the top labeled “Pixel Mode”
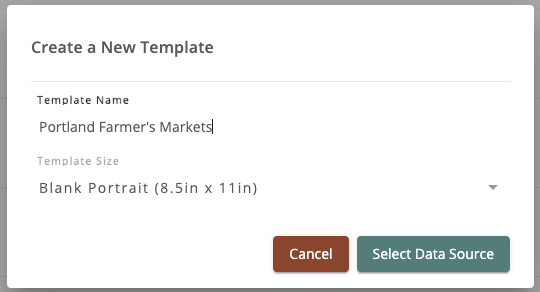
2.) Name your template
Provide a name for your template, like Portland Farmer's Markets and select Blank Portrait (8.5in x 11in) as the template size and click Select Data Source
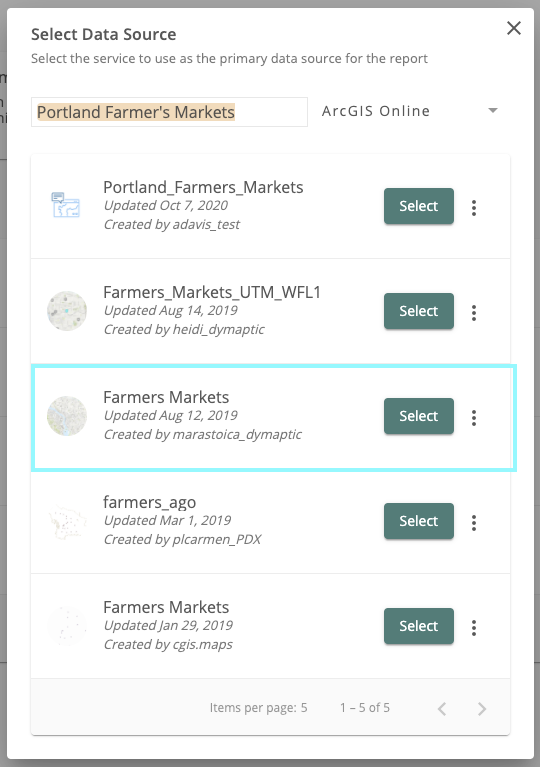
3.) Select the Data Source
Infomaptic lets you easily browse for services within ArcGIS Online, you can search your own content, your organization’s content (that is content that is shared with you) or general content in ArcGIS Online.
For this guide, select “ArcGIS Online” from the dropdown and enter Portland Farmer's Markets. Select, what is probably the third one on the list, called Farmers Markets and is Created by mstoica_dymaptic (fun fact, Mara is our CEO!).
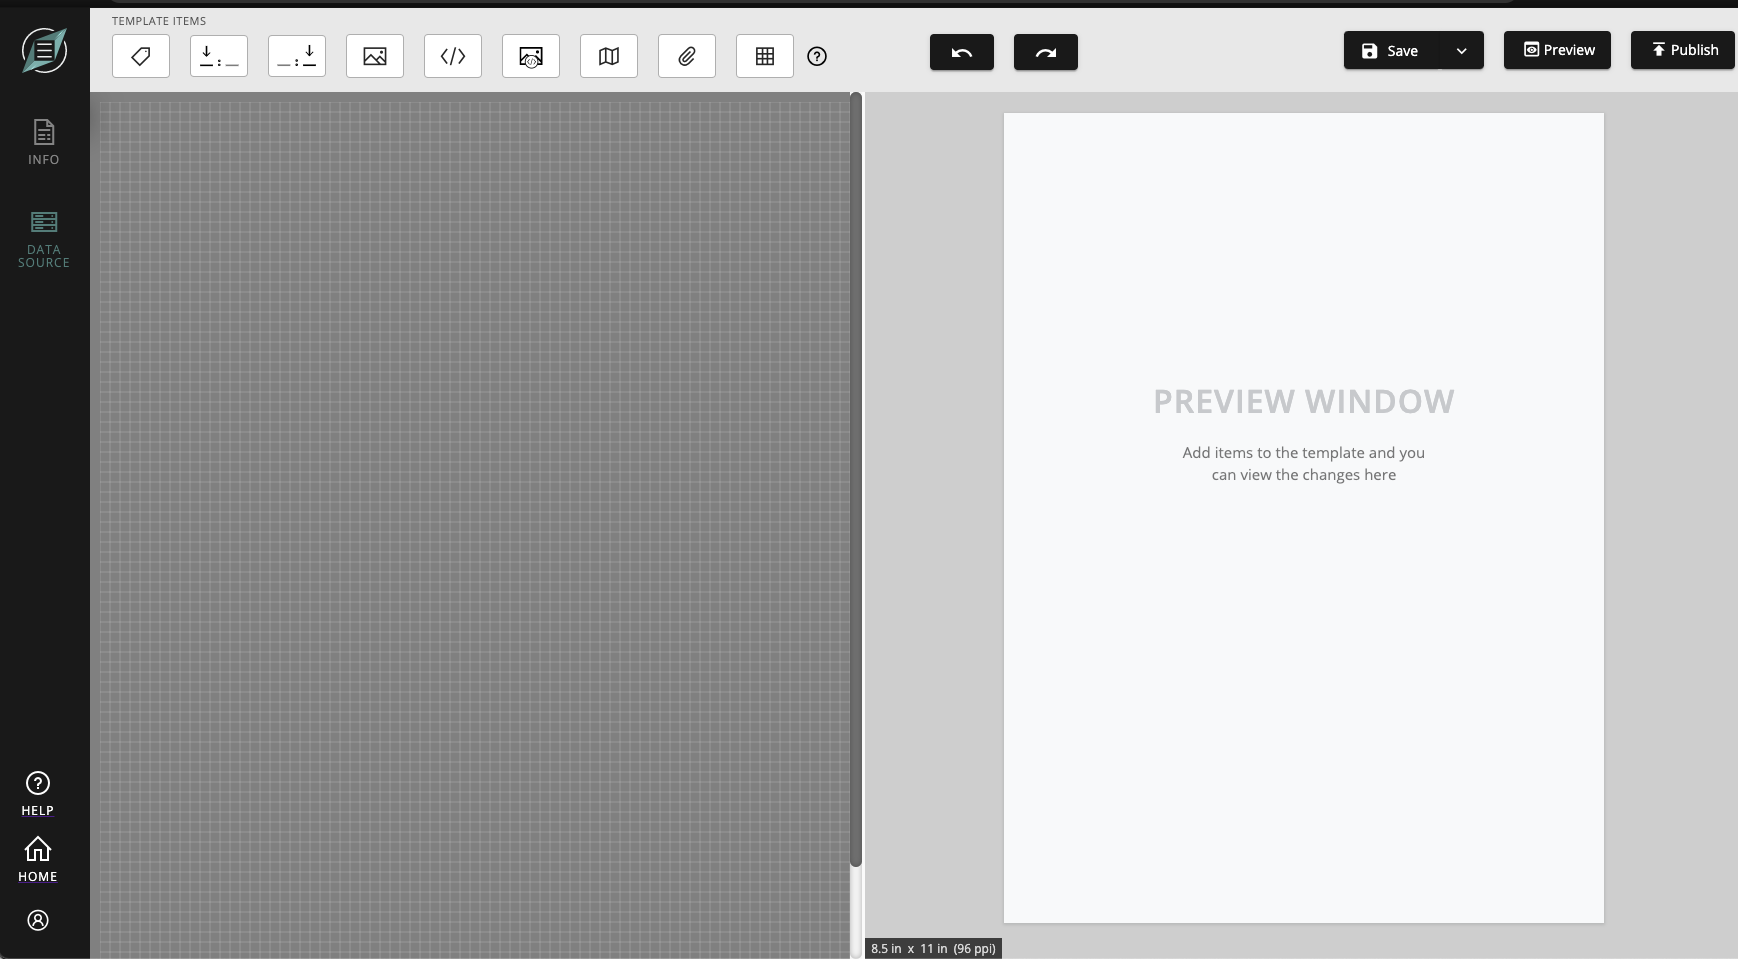
4.) Add Items to the design Surface
You should now be looking at the designer. In Pixel Mode you simply drag the items from the menu at the top (called Template Items) onto the Grid. Once positioned you will get a settings popup for the item. Go ahead, try the one on a left that looks like a Label! (Don’t worry, you can just hit Cancel on the settings popup and continue the tutorial).
5.) Building the Template
a.) Create a banner at the top that will contain the name of the market. To do this, drag the third template item (Field Value) onto the design surface and set the following properties:
- Field Name: Market
- Centered Horizontally
- Centered Vertically
- Bold Font
- Font Size: 40
Click Save.
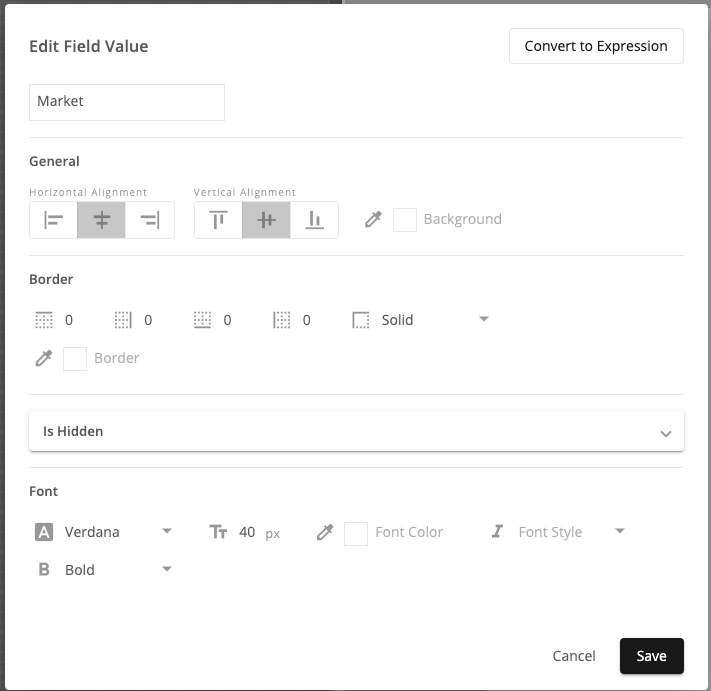
Now Position the item so that it is in the upper left hand corner (pos: 0,0) and then resize it by clicking and dragging the bottom right hand corner of the item so that it is full width and is 22 high. Note that you can see the exact position and size of items in pixel mode in the bottom left corner of the item.

b.) Create the Open Time item
Next we will create a block to hold the open times, this is the orange block the the left under the title in the original design. Drag an Expression item (the 5th item in the toolbar that looks like code brackets) onto the design surface and set the following properties:
- Expression:
"Open " + data.Open_Dates.value - Centered Horizontally
- Centered Vertically
- Background Color:
#ffaa00 - Font Size: 20px
- Font Color:
#ffffff
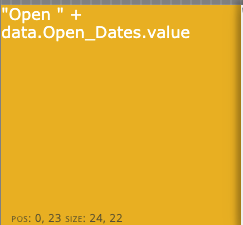
Expressions allow you two write a short bit of code that will alter the original text for the purposes of the report. In this case the attribute Open_Dates contains text like “Year-round” which on it’s own is not super useful, so to give it context we concatenate the text "Open " with that attribute using the expression: "Open " + data.Open_Dates.value
When writing expressions, you can press the run button to get a quick view of what it will look like before saving the item.
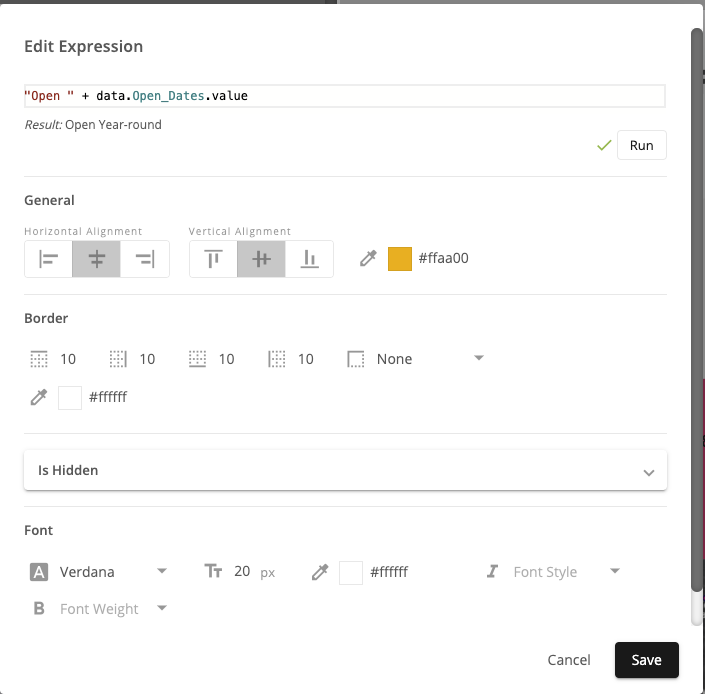
Now, position the item so that it is at: pos: 0, 23 size: 24,22
c.) Copy the item and make the remaining squares
When you hover on an item on the design surface you will see a mini-toolbar appear. This toolbar allows you to open the properties, copy the item or delete it.
Note: You can always undo the previous change or undo a delete by using the Undo button to the right of the items on the main menu at the top.
Since our template has six squares that are all the same size, we’ll use the copy button to make the next five squares. Make a copy and update the settings and position for the following:
- Choose Local
- Expression:
"Choose Local" - Background color:
#efefef - Text color:
#202020 - Position:
Pos: 24, 23, Size: 24, 22
- Expression:
- Days Open
- Expression:
data.day.value + "s" - Background color:
#a3e184 - Text color:
#202020 - Position:
Pos: 48, 23, Size: 24, 22
- Expression:
- Accepts
- Expression:
"Accepts " + data.Accepts.value - Background color:
#228b61 - Text color:
#ffffff - Position:
Pos: 0, 45, Size: 24, 22
- Expression:
- Open Times
- Expression:
data.Open_times.value - Background color:
#ff1a75 - Text color:
#202020 - Position:
Pos: 24, 45, Size: 24, 22
- Expression:
And one more that goes on the next row down:
- Location
- Expression:
data.Location.value - Background color:
#efefef - Text color:
#202020 - Position:
Pos: 48, 67, Size: 24, 22
- Expression:
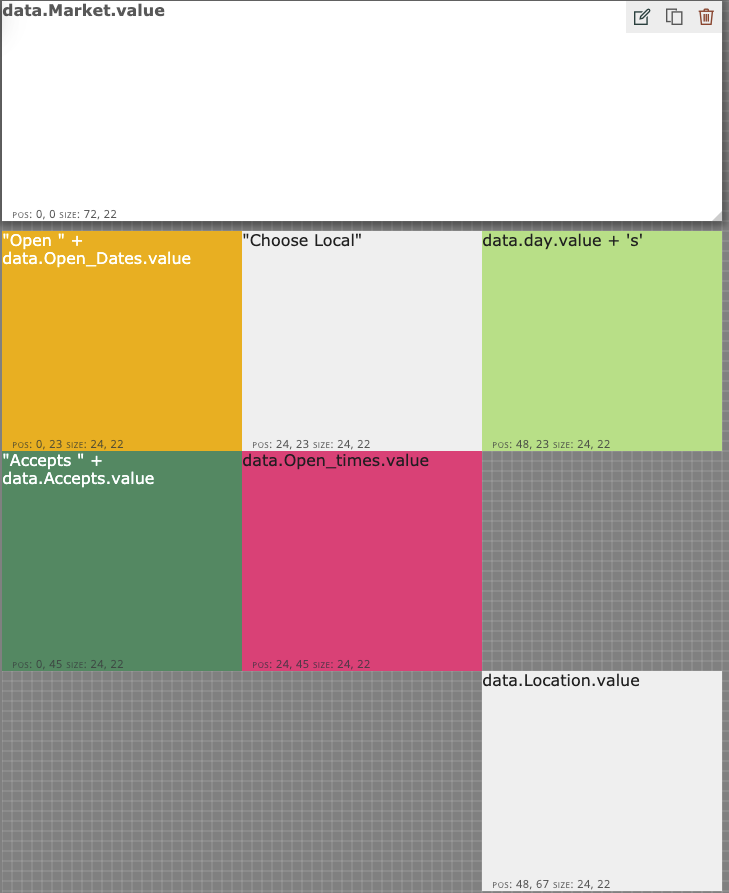
Your template should now look like this:
d.) Add an Image
In the second row of three, to the right of the pink square, we want to add an image. Drag an image item from the toolbar (the forth button) and drop it inside that space.
Use the following properties:
- Image URL: https://calpolyhcs.files.wordpress.com/2012/03/farmers.jpg
- Image Title: Produce
- Image Alt Text: Produce
- Maintain Aspect Ratio: Unchecked
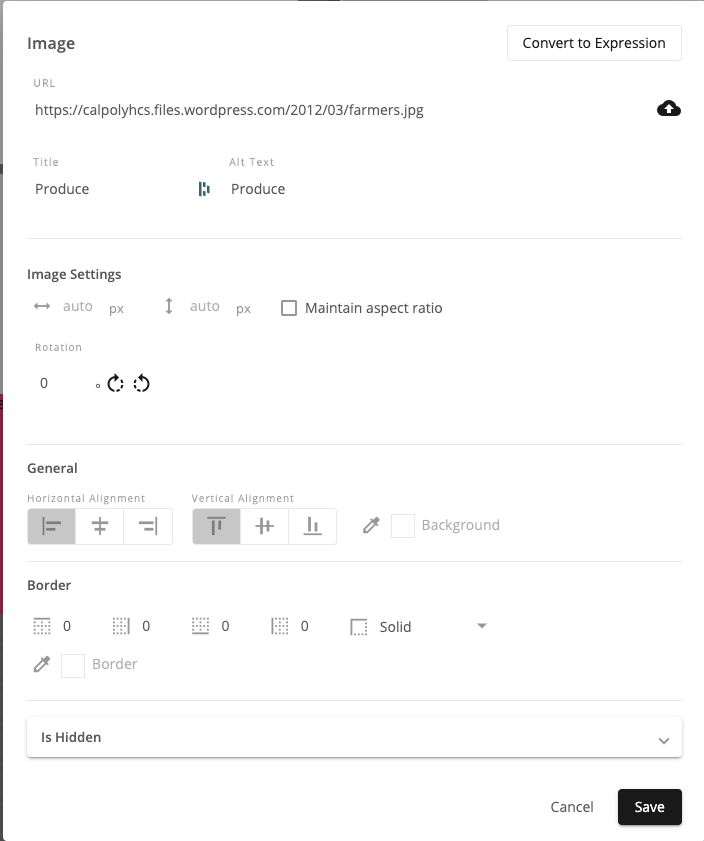
Click Save.
Adjust the size of the item to fill the empty space, the final size should be: Pos: 48, 45, Size: 24, 22.
In Pixel Mode, images are resized automatically to fit within the size of the item on the grid and maintain its aspect ratio. You can control the size of the image in more detail using the properties of the image item. By unchecking the Maintain Aspect Ratio property we allow the image to be stretched to fill the space, in this case our space is very close to the aspect ratio of the image so it looks fine, but you may not want that in your own reports.
Tip: in Pixel Mode, each grid cell is 10x10 pixels, so an item that has a size of 24, 22 is actually 240 pixels long and 220 pixels tall.
e.) Add a Map
We are using ArcGIS Online, so where would we be without a map! We are going to add a map to fill the space to the left of the location box. To add a map, drag that item into the space available (the 7th item, that looks like a tri-folded paper).
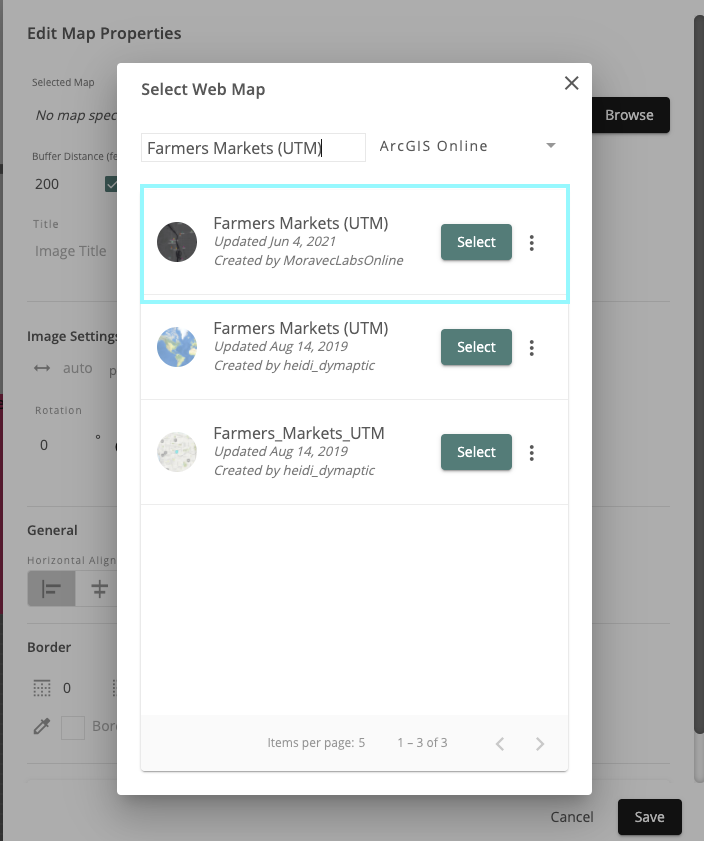
To select the webmap, click on the Browse button and search for Farmers Markets(UTM) in ArcGIS Online. Select the one created by MoravecLabsOnline (that’s Christopher, our CTO).
Set the remaining properties:
- Buffer Distance:
900 - Center map on record: checked
- Maintain aspect ratio: unchecked
Maps are converted to an image when used in a report, so you get similar properties as when working with images.
Tip: Maps can take a while to generate sometimes, slowing down the preview. By doing the map last, you will make the preview more responsive to your changes.
f.) Adding Links (Extra Credit)
For extra credit, trying adding two expressions to the bottom of the template, one to open the map, and one to open the market’s website, here are some expressions to get you started:
- Map URL:
- Expression:
"<a href='https://moraveclabsllc.maps.arcgis.com/apps/View/index.html?appid=f58265d9ee024b8a96e57694785390c1&id="+data.objectid.value+"' >Open Map</a>"
- Expression:
- Market Website:
- Expression:
"<a href='"+data.Website.value+"' >Open Market Website</a>"
- Expression:
Note that right now you have to build the html yourself, we’ll be changing that soon so that you don’t have to. Also, <a href> tags are currently the only html that you can generate using an expression. All other html tags are currently escaped for security reasons.
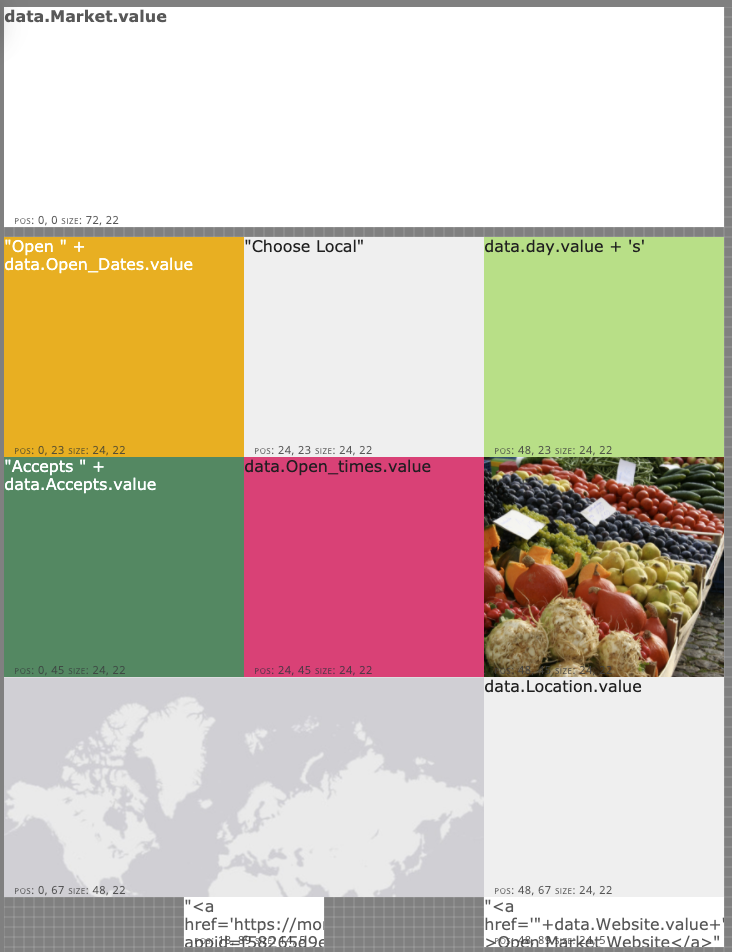
g.) The final template
Your final template should look like this:
5.) Publish Your Template as a Report
Once you’ve finished building the template, you probably want to share the reports with other people. This is where publishing comes in. When you publish your template, it becomes available via a specific URL.
Tip: You can make changes and save them to a template and others won’t see your changes until you publish them.
Publishing is different from Sharing, you still need to share The ArcGIS Online item for your template with others for them to be able to view reports, just like with any other ArcGIS Online app.
To publish your template, click the publish button on the top right.
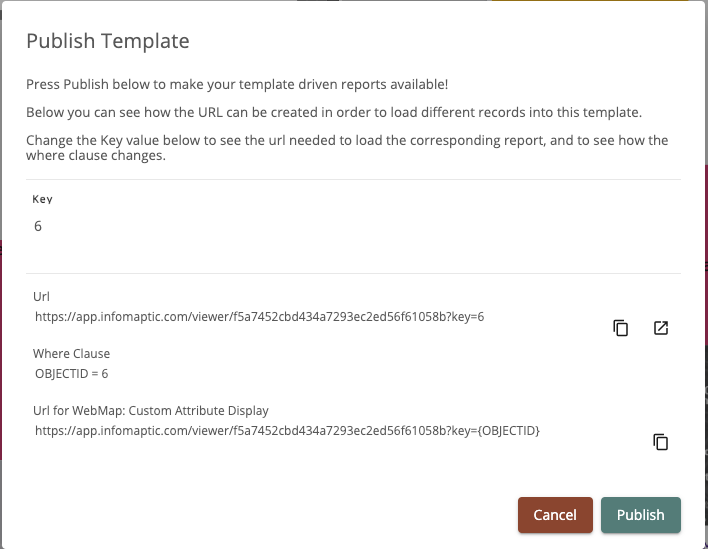
This publish dialog has a lot of information, but the important one is the URL. This Url is where your report will be available. By default, each report is generated based on its ObjectId, which we call the key. In our example, ObjectId 6 is Portland Farmers Market at Portland State University while 7 is Lents International Farmers Market. Here is a table of how that works:
| Market Name | Object ID | Example URL |
|---|---|---|
| Portland Farmers Market at Portland State University | 6 | https://infomaptic-dev.infomaptic.com/viewer/f5a7452cbd434a7293ec2ed56f61058b?key=6 |
| Lents International Farmers Market | 7 | https://infomaptic-dev.infomaptic.com/viewer/f5a7452cbd434a7293ec2ed56f61058b?key=7 |
Your URL will be slightly different because it will have a different item Id.
Once you’ve published your template, you can access it via the URL, and even use that URL in WebMap Popups or other ArcGIS Apps.
Wrap Up
That’s pretty much it. You can find lots of other interesting documents within this site, and other samples to help you get started. If you have questions, please ask us by using any of the methods on the Contact us page.